Displaying a Diagram of a Group's Assignments
To display a diagram of a selected group’s assignments:
- Click
 Groups Manager on the Reveille Admin console toolbar. The Groups Manager window appears.
 - Select a group then click
 Diagram on the Groups Manager toolbar. A diagram of the selected group’s assignments is displayed in the lower half of the window. Hovering the mouse over an item in the group displays a summary over that item’s status.
Following are three example diagrams and a summary of each:
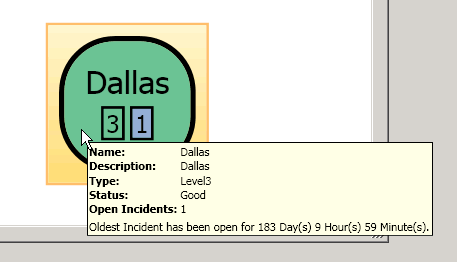
Group Manager Diagram 1

- Group name “Dallas.” The color green indicates that the group’s overall status is “good.”
- Contains 4 monitors---3 have a Status of “Good”; 1 has a Status of “Not Tested.
- Hovering the mouse over the group displays a summary that informs us the group’s Status is “Good” although it has 1 open incident.
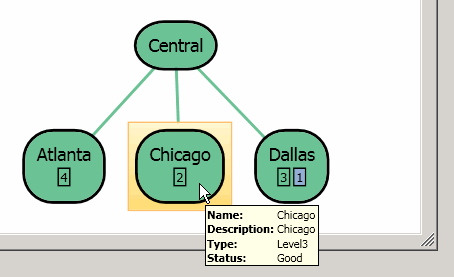
Group Manager Diagram 2

- Group name “Central.” The color green indicates that the group’s overall status is “good.”
- Contains 3 groups---“Atlanta” (contains 4 tested monitors), “Chicago,” (contains 2 tested monitors), and “Dallas” (contains 4 monitors, of which 3 have been tested
- Hovering the mouse over the “Chicago” group displays a summary that informs us the group’s Status is “Good.”
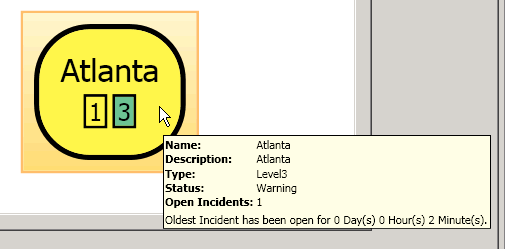
Group Manager Diagram 3

- Group name “Atlanta.” The color yellow indicates that the group’s overall status is at “warning.”
- Contains 4 monitors---1 has a Status of “Warning”; 3 have a Status of “Good.
- Hovering the mouse over the group displays a summary that informs us the group’s Status is “Good” although it has 1 open incident.
Was this helpful?
Please tell us why:
Thank you.